
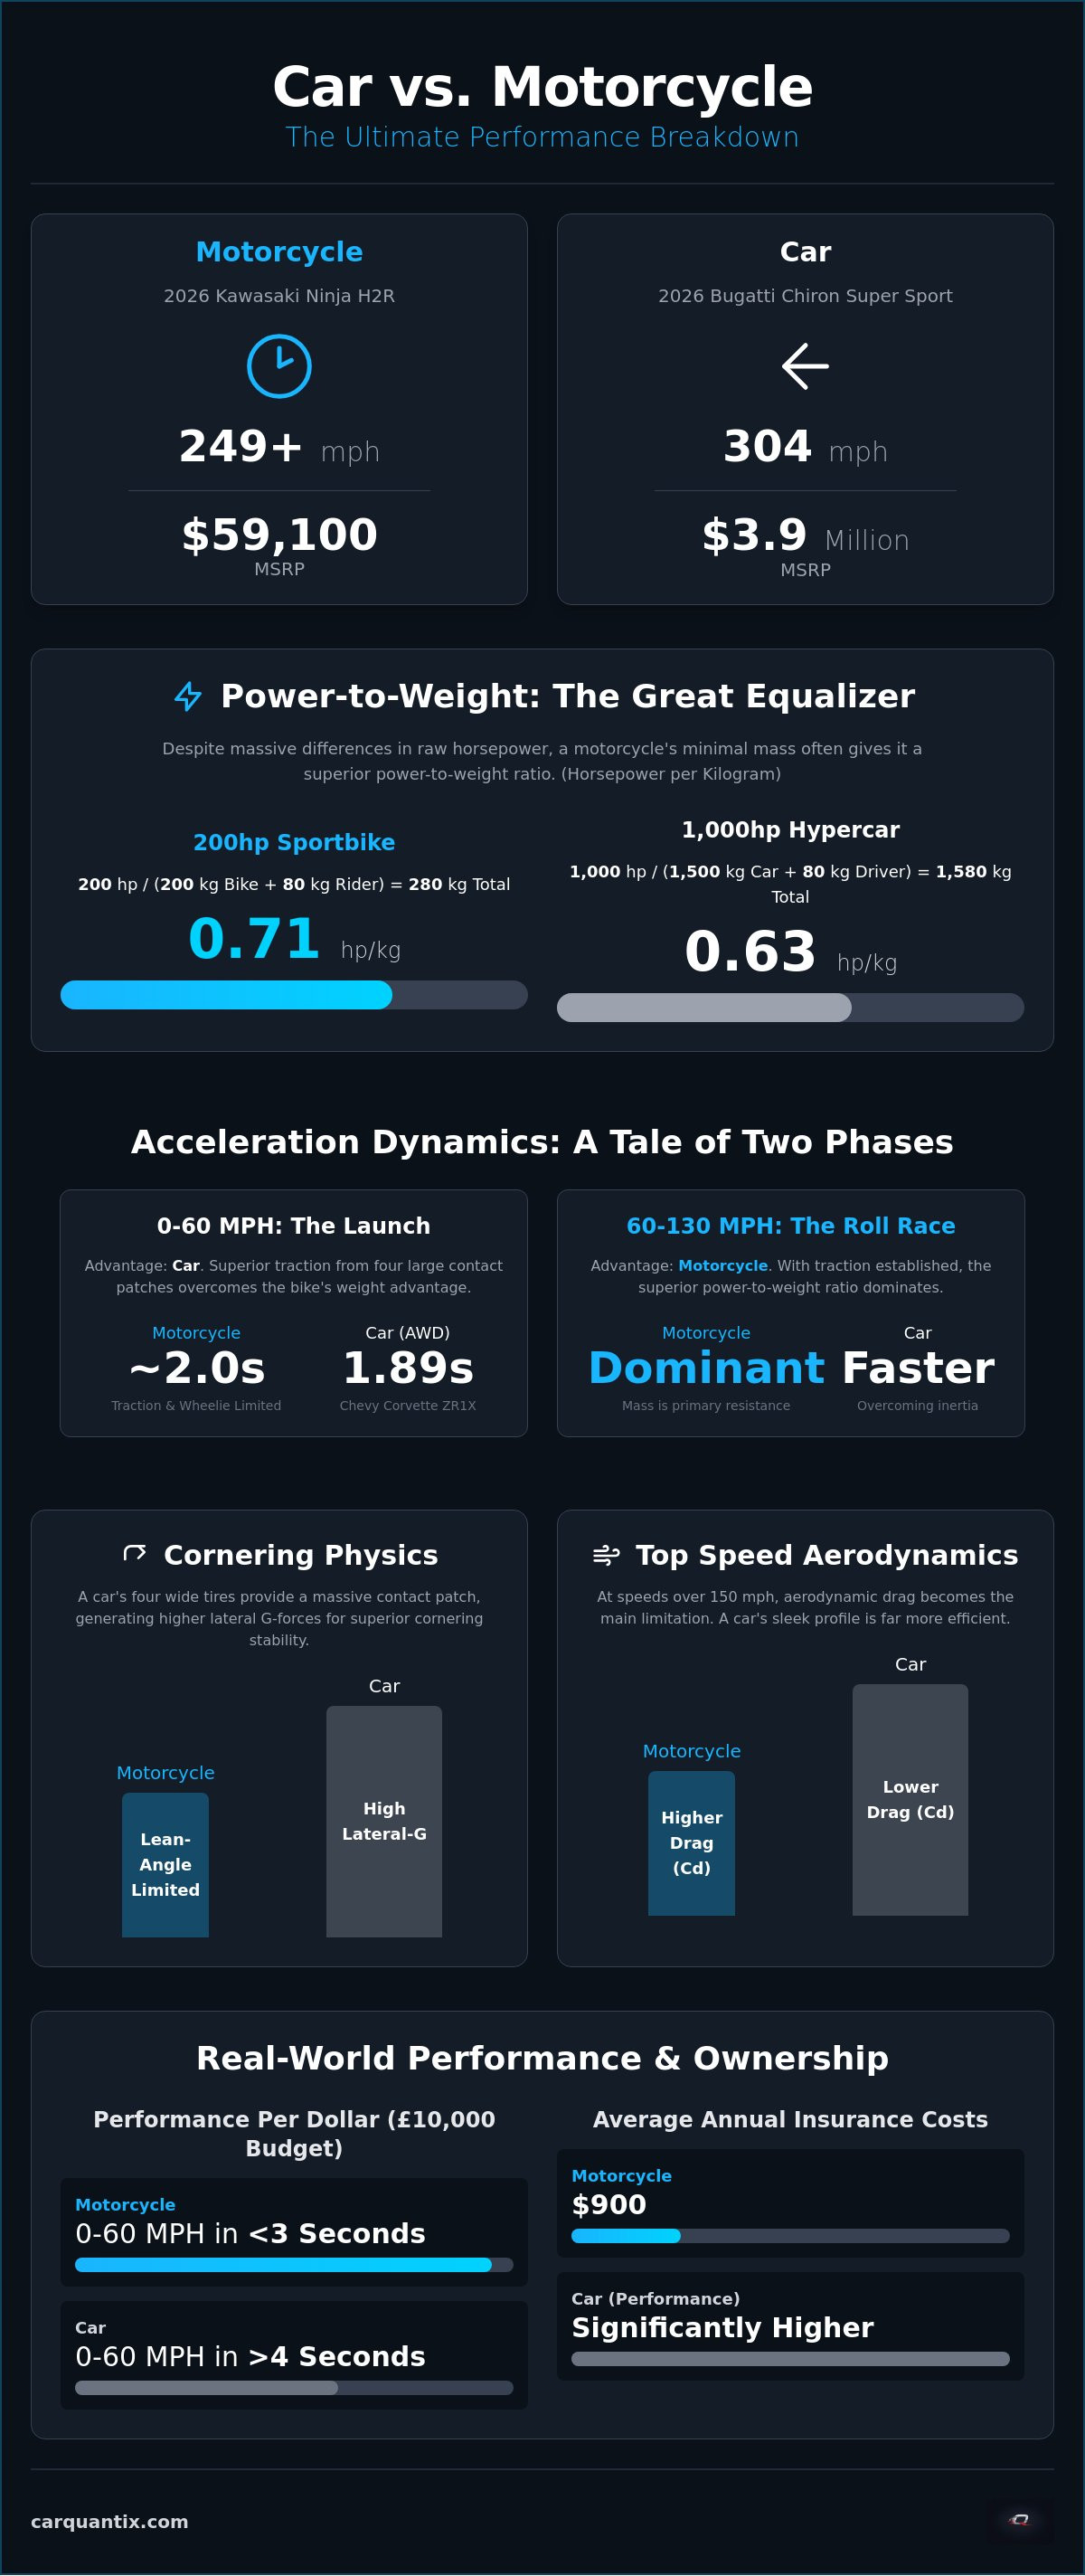
A 2026 Kawasaki Ninja H2R carries an MSRP of $59,100 and reaches speeds exceeding 249 mph, whereas a 2024 Bugatti Chiron Super Sport requires an investment of $3.9 million to achieve its 304 mph limit. This massive delta in price-to-velocity highlights why a car vs motorcycle performance comparison requires more than just surface-level observations. You likely recognize the raw acceleration advantage of two wheels, but quantifying how that translates to real-world cornering or total cost of ownership remains a challenge for many enthusiasts.
This article provides an objective, technical breakdown of the physics and financial variables that separate these two vehicle types. We promise to move beyond anecdotes by analyzing specific data points across acceleration, lateral G-forces, and braking distances. You'll gain access to a framework for comparing performance per dollar, from the 1.89-second 0-60 sprint of the 2026 Chevrolet Corvette ZR1X to the $900 annual insurance averages for motorcycles. This analysis ensures you can move past the confusion of power-to-weight ratios and make a data-backed decision for your next high-performance acquisition.
Key Takeaways
- Analyze how horsepower-to-mass ratios dictate acceleration potential; this explains why motorcycles reach elite performance tiers at lower price points.
- Examine the mechanics of lateral G-forces to understand why a car's larger contact patch provides superior cornering stability compared to a motorcycle's lean-angle constraints.
- Execute a precise car vs motorcycle performance comparison by identifying the specific speed ranges where all-wheel-drive traction overcomes a motorcycle's weight-to-power superiority.
- Compare long-term financial metrics by evaluating the gap between average car insurance costs and the significantly lower premiums typically found in the motorcycle segment.
- Apply a data-driven framework to select your vehicle based on utility, prioritizing either track-day peak velocity or the practical metrics of a high-performance commute.
Table of Contents
Calculating the Power-to-Weight Advantage
The fundamental metric in any car vs motorcycle performance comparison is the power-to-weight ratio. This figure is determined by dividing the vehicle's total horsepower by its gross mass, which includes the weight of the driver or rider. While a high-performance car might possess five times the raw horsepower of a sportbike, it also carries significantly more mass. This weight acts as a parasitic load that requires energy to overcome, leading to diminishing returns where adding more power to a heavy vehicle yields smaller improvements in acceleration. Motorcycles bypass this limitation by maintaining a minimal footprint, allowing them to achieve supercar-level performance ratios at a fraction of the capital investment.
The Mathematics of Mass and Momentum
Analyze the disparity between a 200hp motorcycle and a 1,000hp hypercar. If the bike weighs 200kg and the rider weighs 80kg, the total mass is 280kg, resulting in a ratio of 0.71 hp per kilogram. Contrast this with a 1,500kg car. Even with a 1,000hp engine and an 80kg driver, the ratio is approximately 0.63 hp per kilogram. The motorcycle maintains a technical advantage despite having 800 fewer horsepower. This Motorcycle overview confirms that low mass is the primary driver of two-wheeled efficiency. CarQuantix metrics normalize these figures by accounting for both sprung mass, which is supported by the suspension, and unsprung mass, such as wheels and brakes. Reducing unsprung mass is critical because it directly impacts how quickly a vehicle can change direction and accelerate.
Performance per Dollar: The Entry-Level Reality
Evaluate the "speed floor" for both vehicle types using a hypothetical £10,000 budget. In the used market, this amount secures a liter-class sportbike capable of 0-60 mph in under 3 seconds. Finding a car at the same price point that breaks the 4-second barrier is nearly impossible without extensive modifications. Use our Marketplace Listings to identify high-ratio vehicles that offer the best return on investment. Data shows that motorcycles provide a significantly higher performance-to-cost threshold because they don't require the complex cooling systems, heavy chassis reinforcements, or massive tire sets needed to manage 1,000hp in a car.
Consider the impact of the operator's weight on these calculations. On a 200kg bike, an 80kg rider represents nearly 30% of the total mass, making rider physique a significant performance variable. In a 1,500kg car, that same driver accounts for only 5% of the total mass. This means car performance is more consistent across different drivers, whereas motorcycle performance is highly sensitive to the rider's weight and positioning. CarQuantix tools allow you to input these variables to see how they alter the final performance outcome for specific models.
Acceleration and Top Speed Dynamics
Acceleration isn't a linear variable. In a car vs motorcycle performance comparison, the outcome shifts significantly depending on the velocity bracket being measured. While motorcycles generally dominate the power-to-weight ratio, cars frequently command the advantage in low-speed traction. A 2026 Chevrolet Corvette ZR1X achieves a 0-60 mph time of 1.89 seconds, utilizing all-wheel-drive systems to maximize its mechanical grip. In contrast, even elite electric motorcycles like the Lightning LS-218 struggle to break the 2-second barrier because they are limited by the physics of their footprint. The result depends on the car or motorcycle chosen.
The Traction Limit: Why Bikes Struggle to Launch
Traction is a direct function of the contact patch. A car distributes torque across four wide tires, whereas a motorcycle relies on a single rear contact point roughly the size of a credit card. When maximum torque is applied, motorcycles encounter the "wheelie limit." The high center of gravity relative to a short wheelbase causes the front wheel to lift, forcing electronic aids or the rider to cut power. Modern cars utilize sophisticated launch control and active torque vectoring to maintain acceleration where a bike would simply flip. Understanding these mechanical limits is essential for safety, as detailed in NHTSA motorcycle safety statistics regarding high-performance maneuvers.
Aerodynamics and Top Speed
As speeds exceed 150 mph, the primary adversary shifts from mass to aerodynamic drag. Motorcycles possess a small frontal area, but they are aerodynamically inefficient compared to sleek supercars. A rider creates significant turbulence, resulting in a higher coefficient of drag (Cd) than a streamlined 2026 Porsche 911 Turbo S. This "drag wall" explains why a 200hp bike might struggle to reach 200 mph, while a 600hp car can exceed it. The Bugatti Chiron Super Sport reaches 304 mph by utilizing active aerodynamics to minimize drag, a feat nearly impossible for a conventional motorcycle silhouette. The Kawasaki Ninja H2R manages to exceed 249 mph, but it requires a track-only configuration and extreme forced induction to overcome these aerodynamic penalties.
The transition to electrification is narrowing the gap in torque delivery. Electric motors provide instant peak torque, unlike high-revving internal combustion engines that must climb a specific power curve. This makes modern EVs exceptionally competitive in "rolling" acceleration tests. To see how specific models compare in these categories, use our Car Side-by-Side Comparison tool to review verified telemetry and performance data. This objective approach removes the guesswork from evaluating raw speed metrics.
Cornering Physics: Lean Angle vs. Lateral G-Force
While motorcycles excel in straight-line power-to-weight, any car vs motorcycle performance comparison shifts dramatically upon entering a turn. Lateral grip is a function of the coefficient of friction and the normal force, yet it is heavily dictated by the total contact area. High-performance cars frequently pull over 1.2G in steady-state cornering, while production motorcycles are generally limited to approximately 1.0G. This disparity is not a matter of rider skill but a fundamental constraint of physics and tire technology. The stability of a four-wheel chassis allows for aggressive cornering maneuvers that would exceed the mechanical limits of two wheels.
The Limit of Mechanical Grip
Examine the disparity in the contact patch. A performance car like the 2026 Porsche 911 Turbo S utilizes four tires with substantial widths, providing a total contact area of roughly 180 to 220 square inches. In contrast, a motorcycle relies on two narrow points that, even at full lean, rarely exceed 10 square inches of combined surface area. This "Contact Patch" limitation is the primary reason bikes cannot match the mid-corner speeds of four-wheeled vehicles. A technical analysis of bicycle and motorcycle dynamics reveals that two-wheeled stability is inherently tied to gyroscopic effects and lean angles, which creates a mechanical ceiling for lateral acceleration.
Trail braking also differs between the platforms. In a car, a driver can maintain high brake pressure deep into a corner because the four-wheel chassis remains stable under load. A motorcyclist must be much more precise; excessive brake force while leaned over can easily overwhelm the limited front-tire grip, leading to a low-side crash. The ability to make mid-corner corrections is significantly higher in a car, where weight transfer is managed across two axles rather than a single pivot point. High-performance cars also benefit from aerodynamic downforce, which increases the normal force on the tires without adding mass, a feature largely absent on motorcycles due to the changing orientation of the vehicle during lean.
Braking Distance and Deceleration
Analyze the 100-0 km/h (62-0 mph) deceleration data to see the safety implications of these physics. High-performance cars consistently stop in 30 to 33 meters. Production motorcycles typically require 38 to 42 meters to reach a full stop from the same speed. This gap exists because cars can utilize all four tires for maximum deceleration without the risk of flipping. Motorcycles are limited by their short wheelbase and high center of gravity, which often leads to "stoppies" or rear-wheel lift if the front brake is applied too aggressively. Our Performance Rankings account for these braking metrics to provide a transparent view of total vehicle capability. Using these rankings helps you understand that while a bike is faster to 100 mph, the car is significantly faster at returning to zero.
Real-World Performance and Ownership Metrics
Operational efficiency is often overlooked when conducting a car vs motorcycle performance comparison. While the previous sections detailed the physics of speed and cornering, the fiscal reality of maintaining that performance dictates long-term viability. Performance per dollar is a metric that shifts over time as consumables like tires and fuel are depleted. A vehicle that is inexpensive to acquire may prove prohibitive to operate under high-utilization scenarios. Analyzing the Total Cost of Ownership (TCO) provides a more accurate reflection of value than MSRP alone.
Maintenance and Consumables
Maintenance schedules for high-performance vehicles vary significantly between two and four wheels. High-revving motorcycle engines often require more frequent valve adjustments and oil changes compared to larger displacement car engines. Tire longevity is another critical variable. A set of high-performance motorcycle tires typically requires replacement every 3,000 to 5,000 miles due to the softer compounds needed for grip. In contrast, performance car tires often last 15,000 to 20,000 miles under similar conditions. Our Car Fuel Cost Calculator logic demonstrates that while motorcycles achieve superior MPG, the high frequency of tire and chain maintenance can equalize the per-mile operating cost with many sports cars.
Insurance and Risk Assessment
Insurance premiums are dictated by performance-to-risk ratios. As of June 2026, the average annual cost for full coverage car insurance is approximately $2,578. Motorcycle insurance remains significantly more accessible, ranging from $900 to $1,500 annually for full coverage as of March 2026. This lower entry point for insurance often offsets the higher maintenance frequency of motorcycles. However, limited-edition performance cars generally exhibit better market value retention. A 2026 Porsche 911 Turbo S will likely depreciate at a slower rate than a mass-production liter-bike, making the car a more stable asset over a five-year horizon.
Daily utility remains the most significant non-performance differentiator. Cars offer weather protection, climate control, and cargo capacity that motorcycles cannot replicate. A motorcycle requires additional investment in safety gear and specialized luggage systems to approach even basic levels of utility. When evaluating these vehicles, consider the "hidden" costs of ownership such as specialized tools for DIY maintenance or the cost of secure storage. Use our Marketplace Listings to compare current resale values and mileage metrics for specific models to see how these ownership costs manifest in the real world. This data-driven approach ensures your choice is supported by financial logic rather than anecdotal evidence.
Data-Driven Selection: Which Performance Vehicle Wins?
A comprehensive car vs motorcycle performance comparison reveals that no single vehicle type dominates all categories. The "winner" is a subjective label that becomes objective only when you apply specific weights to variables like lateral grip, acceleration, and total cost of ownership. If your goal is to achieve the fastest 0-60 mph time for the lowest possible capital outlay, the motorcycle is the undisputed leader. If your priority is high-speed cornering stability and short braking distances, the four-wheeled platform provides a superior mechanical ceiling. Reconciling these data points requires a disciplined approach to your specific use case.
Defining Your Performance Goals
Analyze your primary driving environment before finalizing a purchase. A track-focused user might prioritize the 1.2G lateral acceleration of a 2026 Porsche 911 Turbo S over the raw power-to-weight ratio of a liter-bike. Consistency in lap times often favors the car because its four-wheel chassis is less sensitive to minor operator errors and mid-corner surface changes. Conversely, if your metrics focus on the thrill of a sub-3-second sprint during a weekend ride, the motorcycle provides that experience at a fraction of the supercar price.
Weight the utility factor heavily if the vehicle serves as a primary mode of transport. The safety systems and climate control of a car justify the higher average insurance cost of $2,578 when compared to the $900 to $1,500 range for motorcycles. Cargo space and weather protection are non-performance metrics that fundamentally impact the vehicle's utility-per-dollar value. Base your final selection on measurable data and verified telemetry rather than the emotional influence of brand marketing.
Leveraging CarQuantix for Smarter Buying
Use the Car Side-by-Side Comparison tool to execute a granular analysis of specific models. This utility allows you to normalize performance figures across different engine types and weight classes, providing a transparent view of how a 600hp car actually stacks up against a 200hp bike in real-world scenarios. To identify "sleeper" value, consult our Performance Rankings. These rankings highlight vehicles that offer elite horsepower-per-dollar ratios but may not carry the premium price tag of more famous marques.
Once your technical requirements are defined, visit the CarQuantix Marketplace to browse vetted listings. This marketplace focuses on high-performance vehicles, allowing you to filter by the exact price and mileage metrics discussed in this analysis. You can also set up automated alerts for specific performance thresholds, ensuring you're notified the moment a vehicle matching your data-driven criteria becomes available. This systematic approach reduces the stress of complex automotive choices by providing a professional framework for evaluation.
Optimizing Your High-Performance Acquisition
Selecting between two and four wheels requires a systematic evaluation of specific performance thresholds. This car vs motorcycle performance comparison demonstrates that while motorcycles offer unparalleled power-to-weight efficiency, cars provide a higher ceiling for lateral grip and deceleration stability. Your final decision should align with your primary utility requirements, whether you prioritize the 1.89-second sprint of a 2026 Corvette ZR1X or the cost-effective velocity of a liter-class sportbike. Both platforms possess unique mechanical advantages that suit different driving environments and budget constraints.
Use our specialized toolsets to validate your choice before committing capital. You can compare performance metrics side-by-side on CarQuantix to access premium performance data and real-time marketplace price tracking. Utilize our advanced fuel and charging cost calculators to project annual operational expenses with precision. It's a disciplined approach that removes the uncertainty from high-stakes automotive decisions. We provide the technical framework necessary to secure a vehicle that meets your exact performance and budgetary standards.
Frequently Asked Questions
Is a motorcycle faster than a supercar in a 0-60 mph sprint?
Elite motorcycles traditionally dominated this metric, but modern all-wheel-drive hypercars have closed the gap. The 2026 Chevrolet Corvette ZR1X achieves 0-60 mph in 1.89 seconds, while high-performance electric motorcycles like the Lightning LS-218 record times just under 2 seconds. While motorcycles offer superior power-to-weight ratios, cars utilize a larger contact patch and sophisticated launch control to maximize initial traction.
Why do cars corner faster than motorcycles despite having more weight?
Mechanical grip is the primary differentiator in cornering performance. A car utilizes four wide tires, providing roughly 20 times the contact surface area of a motorcycle. This allows high-performance cars to pull over 1.2G in lateral acceleration, whereas motorcycles are limited to approximately 1.0G by their lean angle and narrow tire profile. Aerodynamic downforce further increases a car's stability at high speeds.
Which is cheaper to maintain: a performance car or a sportbike?
Motorcycles generally have lower absolute maintenance costs, but they require more frequent service intervals. High-performance motorcycle tires often need replacement every 3,000 to 5,000 miles, while car tires can last up to 20,000 miles. A sportbike's high-revving engine also demands more regular oil changes and valve adjustments. Over a five-year period, the higher frequency of motorcycle consumables can narrow the total cost gap.
Do motorcycles or cars have better fuel efficiency at high speeds?
Motorcycles achieve superior fuel economy at legal highway speeds due to their low mass. However, as speeds exceed 150 mph, the aerodynamic drag coefficient of a motorcycle becomes a significant penalty. A streamlined supercar like the 2026 Porsche 911 Turbo S is more aerodynamically efficient than a rider on a bike. At these extreme velocities, the motorcycle's fuel advantage diminishes as the engine works harder to overcome air resistance.
Can a car stop faster than a motorcycle in an emergency?
Cars consistently outperform motorcycles in emergency braking tests. A high-performance car can decelerate from 62-0 mph in roughly 30 to 33 meters, while a sportbike typically requires 38 to 42 meters. The four-wheel platform allows for maximum braking pressure without the risk of the vehicle flipping. Motorcycles are limited by their short wheelbase, which can cause the rear wheel to lift during aggressive deceleration.
How does power-to-weight ratio affect real-world driving performance?
This ratio is the most critical factor in a car vs motorcycle performance comparison for overtaking and acceleration. A high power-to-weight ratio allows a vehicle to change velocity rapidly with minimal engine effort. Because motorcycles weigh significantly less than cars, they can achieve supercar-level acceleration using much smaller engines. This efficiency makes them exceptionally responsive during mid-range speed transitions on public roads.
What performance metrics should I prioritize when using a comparison tool?
Prioritize metrics that align with your primary use case. If you value track day consistency, focus on lateral G-force and braking distances. For those seeking acceleration thrills, 0-60 mph and 60-130 mph times are the most relevant data points. Use the CarQuantix side-by-side tool to filter by these specific variables. This ensures your final decision is based on technical capability rather than brand marketing.
Is an electric car faster than a petrol motorcycle in acceleration?
Modern electric cars often outperform petrol motorcycles in initial acceleration. Electric motors deliver peak torque instantly from zero RPM, and all-wheel-drive systems distribute that power effectively across four tires. While a petrol motorcycle must climb a power curve and manage traction on one wheel, an EV like the Rimac Nevera can maintain a continuous, high-G launch. This technological shift has redefined the hierarchy of rapid acceleration.