
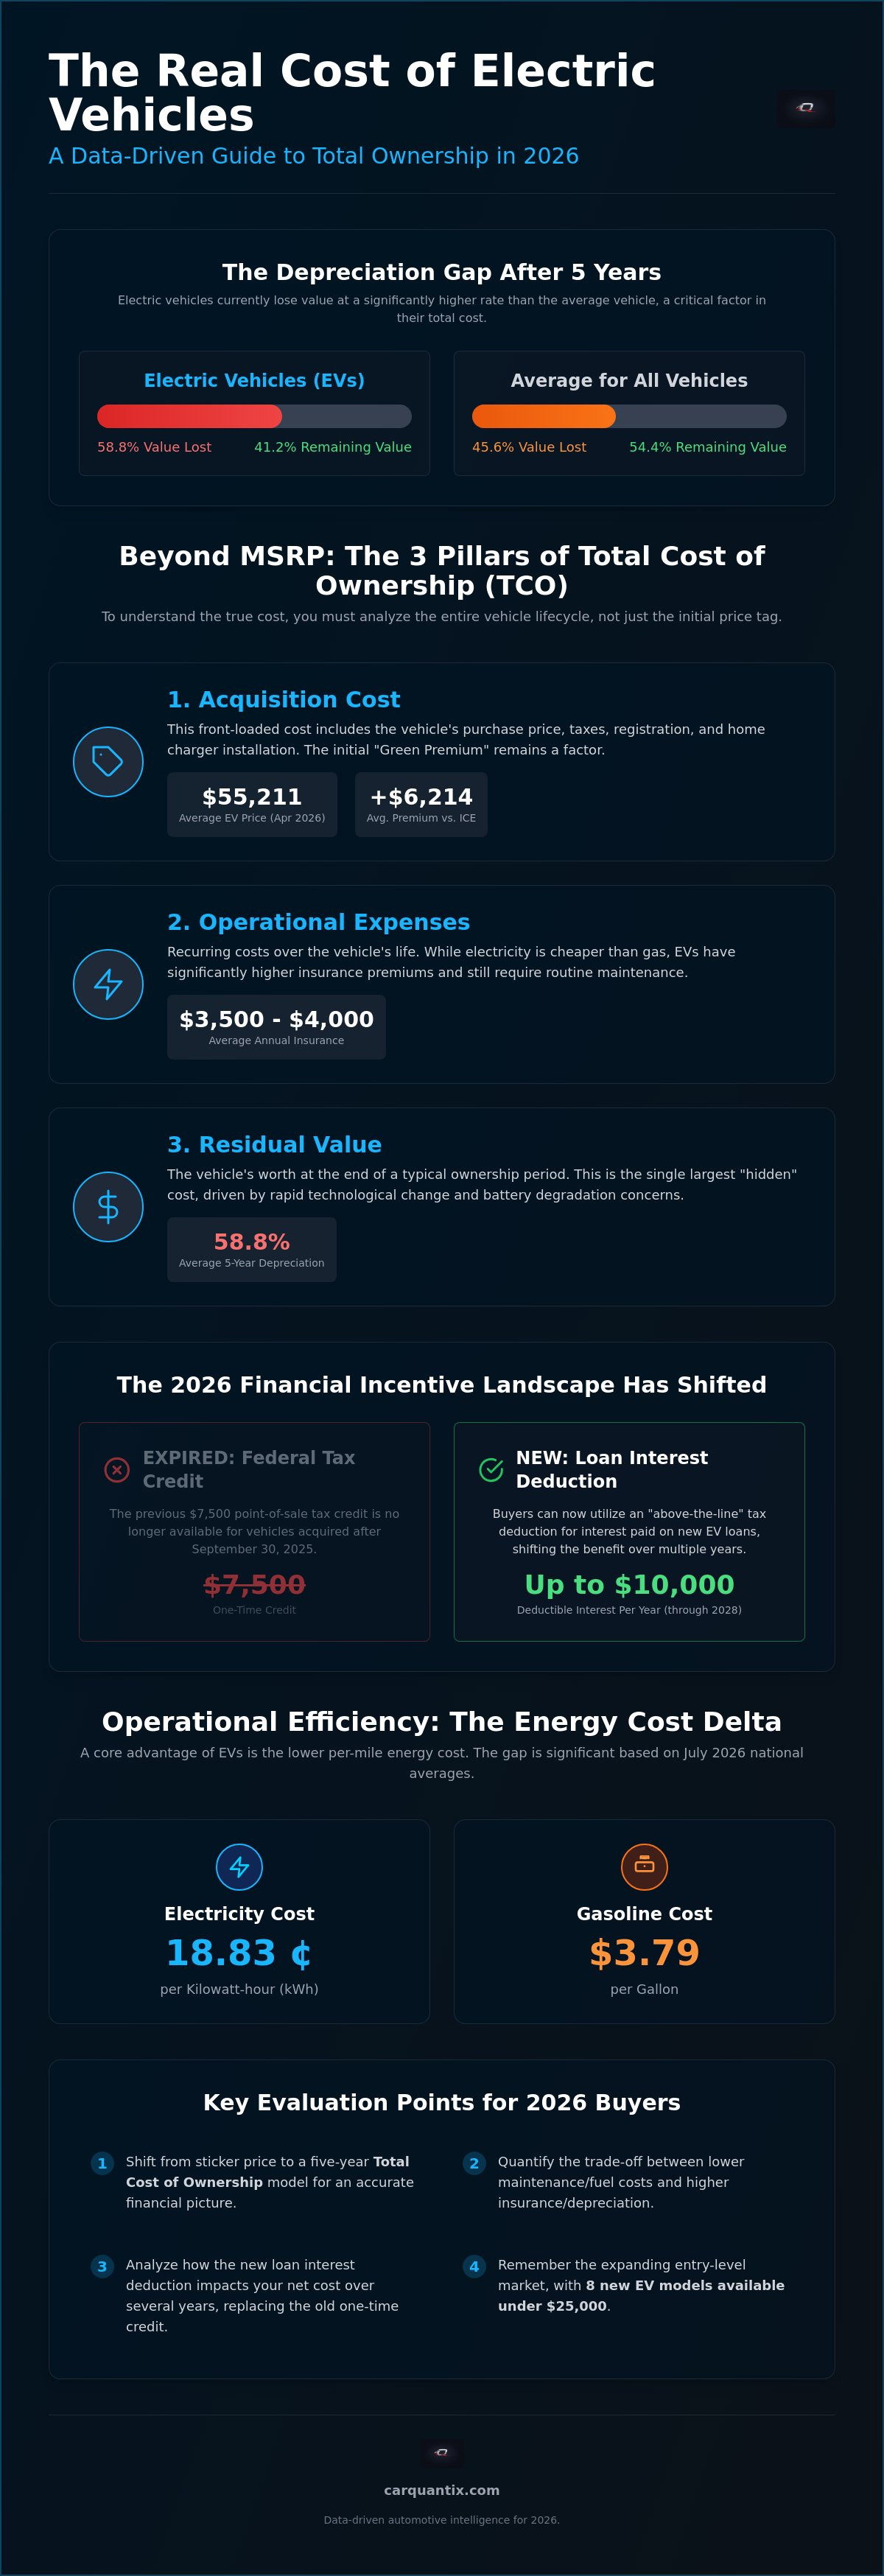
An electric vehicle loses an average of 58.8% of its value over five years, a depreciation rate significantly higher than the 45.6% average for all vehicles in 2026. You've likely noticed that the financial math for switching to battery power has become increasingly complex. With federal purchase credits expired as of late 2025 and insurance premiums now averaging $3,500 to $4,000 annually, determining the actual electric vehicle cost requires looking far beyond the sticker price.
It's natural to feel uncertain when balancing the June 2026 home charger credit deadline against new tax deductions for loan interest. This analysis provides an objective, data-driven framework to help you evaluate the total cost of ownership (TCO) with precision. We move past the marketing hype to calculate the intersection of regional utility rates, maintenance schedules, and residual values.
You'll find a clear breakdown of energy versus fuel expenses and a comparison of which vehicle segments offer the most value. This guide ensures your next automotive decision is based on verified 2026 data rather than outdated assumptions.
Key Takeaways
- Shift your evaluation from the initial sticker price to a five-year Total Cost of Ownership model to capture the actual financial impact of the transition.
- Analyze how the expiration of federal purchase credits and the introduction of new tax deductions for loan interest redefine the net electric vehicle cost in 2026.
- Calculate operational savings by comparing regional electricity rates against current gasoline prices using a standardized efficiency formula.
- Quantify the trade-off between higher insurance premiums and accelerated depreciation against the significantly lower maintenance requirements of battery electric systems.
- Identify the optimal value in the current marketplace by using side-by-side performance data to maximize range and utility per dollar invested.
Table of Contents
- Beyond the MSRP: Redefining Electric Vehicle Cost for 2026
- Calculating the Upfront Investment: Purchase Price, Taxes, and Incentives
- Operational Efficiency: The EV Charging Cost vs. Gasoline Delta
- The Hidden Variables: Depreciation, Maintenance, and Insurance Premiums
- Strategic Selection: Using Performance Data to Optimize Your EV Investment
Beyond the MSRP: Redefining Electric Vehicle Cost for 2026
Evaluating an automobile based solely on its Manufacturer's Suggested Retail Price (MSRP) provides an incomplete financial picture. For a precise electric vehicle cost analysis, you must utilize Total Cost of Ownership (TCO) as your primary metric. This approach accounts for every dollar spent from the moment of purchase to the final resale. While the "Green Premium", the upfront price gap between electric and gasoline models, is shrinking, it remains a factor. As of April 2026, the average transaction price for a new EV was $55,211, which is $6,214 higher than the internal combustion engine (ICE) average. Focusing only on this delta ignores the long-term fiscal mechanics of the vehicle.
Our methodology at CarQuantix focuses on logic-driven comparisons rather than lifestyle marketing. We act as an impartial filter, providing data that helps you move beyond surface-level pricing. We categorize Total cost of ownership for EVs into three distinct pillars that define the electric vehicle cost over time:
- Acquisition: This includes the purchase price, registration fees, and home charging installation costs.
- Operation: This covers recurring expenses such as electricity, insurance premiums, and routine maintenance.
- Residual Value: This measures the asset's worth at the end of a five-year period, specifically accounting for the 58.8% average depreciation rate currently observed in the EV segment.
The Acquisition vs. Operation Paradox
Electric vehicles operate on a front-loaded cost structure. You pay more at the dealership to secure lower per-mile expenses later. Contrast this with ICE vehicles, which often have lower entry prices but escalating maintenance curves as mechanical components age. Finding the breakeven point is the critical variable. For many 2026 buyers, annual maintenance savings must be weighed against insurance premiums that can reach $4,000. The math changes based on your annual mileage and charging habits.
Key Financial Metrics for 2026 Buyers
To achieve clarity, use Cost per Mile (CPM) as your primary unit of measurement. This metric levels the playing field between disparate energy sources. It allows you to determine Efficiency Parity, the point where electricity costs match the utility of gasoline. With the national average electricity rate at 18.83 cents per kWh and gasoline at $3.79 per gallon in July 2026, the delta is significant. High-utility tools like side-by-side performance rankings help verify these variables for your specific region.
Calculating the Upfront Investment: Purchase Price, Taxes, and Incentives
Determining the initial electric vehicle cost requires a granular look at MSRP trends and the shifting regulatory environment of July 2026. The market has reached a significant milestone in price parity. Mid-size electric models now frequently match their gasoline counterparts in base pricing; however, the average transaction price for a new EV remains at $55,211 as of April 2026. This average is skewed by the luxury SUV segment, while the entry-level market has expanded. Eight new models are currently available for under $25,000, providing accessible entry points for budget-conscious buyers. Use a Car Side-by-Side Comparison to evaluate how these base prices align with specific performance metrics.
Sales tax implications also factor into the total acquisition cost. Many states apply standard percentage rates, but several regions offer partial exemptions or reduced registration fees for alternative fuel vehicles. These localized variables can alter the final "out-the-door" price by thousands of dollars, making regional research a procedural necessity before signing a purchase agreement.
Navigating the 2026 Incentive Landscape
The federal incentive structure underwent a total transition in late 2025. The previous Federal EV tax credits of $7,500 are no longer available for vehicles acquired after September 30, 2025. In their place, buyers now utilize an "above-the-line" tax deduction. This allows eligible taxpayers to deduct up to $10,000 per year in interest paid on new vehicle loans through 2028. This mechanism shifts the financial benefit from a one-time credit to a multi-year reduction in taxable income, rewarding those who finance their investment.
The Cost of Home Infrastructure
A functional home charging setup is a mandatory soft cost for most owners. Hardware for a Level 2 smart charger typically ranges from $500 to $900 in 2026. Installation labor introduces the most significant variable. A simple circuit addition might cost $400, but a full electrical panel upgrade to handle the 40-50 amp load can exceed $2,000. Administrative costs, including municipal permits and safety inspections, add another $150 to $300 to the total. It's critical to note that the federal 30% tax credit for charger installation (up to $1,000) expired on June 30, 2026. Buyers must now rely on regional utility rebates, which frequently cover a portion of the hardware costs in exchange for participation in managed charging programs.
Operational Efficiency: The EV Charging Cost vs. Gasoline Delta
Calculating the operational component of the electric vehicle cost requires a standardized mathematical approach. Use the formula: (Annual Miles Driven / Vehicle Efficiency) * Cost of Energy. This calculation is a core element of the total cost of ownership for electric vehicles. For a typical sedan achieving 3.5 miles per kWh, driving 12,000 miles annually requires 3,428 kWh of energy. At the April 2026 national average residential rate of 18.83 cents per kWh, the annual energy cost is approximately $645. In contrast, a gasoline vehicle averaging 30 MPG requires 400 gallons of fuel. At the July 2026 average price of $3.79 per gallon, the annual fuel expense reaches $1,516. This creates an operational delta of $871 per year in favor of the electric model.
Vehicle performance metrics such as weight and aerodynamics directly dictate energy consumption. Heavier electric SUVs often drop to 2.5 miles per kWh, increasing the energy requirement to 4,800 kWh for the same 12,000 miles. This shift raises the annual electric vehicle cost for energy to $904. Aerodynamic drag at highway speeds also compounds this consumption, making efficiency ratings a more critical variable for high-mileage drivers than for urban commuters. You can use an Electric Vehicle Charging Cost Calculator to input localized utility rates for a more precise regional analysis.
Home Charging Economics
Residential charging offers the highest utility through Time-of-Use (TOU) utility rates. Many providers offer reduced pricing during off-peak overnight windows, sometimes dropping rates below 10 cents per kWh. To compare these costs accurately against traditional fuels, use the Gasoline Gallon Equivalent (GGE). Gasoline Gallon Equivalent (GGE) is the amount of alternative fuel required to equal the energy content of one US gallon of gasoline. One gallon of gasoline contains approximately 33.7 kWh of energy. At average 2026 rates, a "gallon" of electricity costs roughly $6.34, but because electric motors are three to four times more efficient than internal combustion engines, the actual cost to move the vehicle is significantly lower.
Public Charging and the Convenience Premium
Relying on public infrastructure alters the financial landscape. Average DC fast charging costs reached $0.50 per kWh in early 2026, which is nearly triple the cost of residential energy. At this rate, the annual cost for 12,000 miles in our example sedan climbs to $1,714, effectively erasing the fuel savings over a gasoline vehicle. Major charging networks utilize tiered pricing structures, often requiring monthly subscriptions to access lower per-kWh rates. Additional hidden variables include session connection charges and idle fees, which penalize users who remain connected after the charging cycle is complete. These premiums make home charging the only logical primary energy source for maximizing your investment.
The Hidden Variables: Depreciation, Maintenance, and Insurance Premiums
The financial trajectory of an electric vehicle diverges sharply from internal combustion models after the initial purchase. While operational savings are quantifiable, hidden variables like depreciation and insurance premiums exert significant pressure on the total electric vehicle cost. Data from 2026 indicates that EVs lose an average of 58.8% of their value over five years. This exceeds the 45.6% average for the broader automotive market. For a $40,000 vehicle, this depreciation curve translates to a $5,280 loss beyond that of a comparable gasoline car. Battery health remains the primary driver of this volatility, as used market buyers prioritize verifiable remaining capacity over traditional mileage.
Insurance costs present another hurdle. Full-coverage premiums for an EV currently average between $3,500 and $4,000 annually, compared to $2,700 for gasoline models. This 42% premium stems from higher repair costs, specialized materials, and the $5,000 to $22,000 expense of battery pack replacement. The gap for 2026 model year vehicles is narrowing to approximately 18% as repair networks mature and diagnostic tools become more accessible. To see how these variables impact specific models, consult our Performance Rankings for data-backed valuation.
Depreciation Curves and Residual Value
Analyze how 2026 battery longevity standards are beginning to stabilize these curves. Mass-market EVs now benefit from improved thermal management that preserves lithium-ion chemistry over longer cycles. Software-defined vehicle (SDV) architectures also support residual value by allowing over-the-air updates to improve efficiency and feature sets post-purchase. This reduces the technological obsolescence risk that plagued early-generation models. Luxury EVs typically experience steeper initial drops than mass-market counterparts over the first 36 months of ownership.
Maintenance Realities: Beyond the Engine
The maintenance profile of an EV is characterized by mechanical simplicity. Annual routine service costs are estimated at $150 to $300, a significant reduction from the $900 to $1,800 range required for ICE vehicles. You eliminate oil changes, spark plugs, and timing belts. Regenerative braking also extends the life of brake pads and rotors significantly. However, you must account for accelerated tire wear. The instantaneous torque and high curb weight of EVs lead to more frequent tire replacements, which can offset a portion of the mechanical savings. Thermal management systems also require periodic fluid checks to ensure battery cooling efficiency remains optimal.
Strategic Selection: Using Performance Data to Optimize Your EV Investment
Optimizing your investment requires a shift from brand-centric shopping to quantitative analysis. A high-capacity battery represents a significant portion of the total electric vehicle cost. If your daily utility cycle is less than 50 miles, paying for a 300-mile range battery introduces a capital inefficiency. You are essentially paying for weight and capacity that remains underutilized while negatively impacting your efficiency per kilowatt-hour. Identifying performance-per-dollar leaders in 2026 involves calculating the range-to-price ratio alongside the residual value projections we established in previous sections.
The logic of segment selection also dictates that a Battery Electric Vehicle (BEV) is not always the most fiscal choice. For buyers who cannot install home infrastructure and must rely on public DC fast charging at $0.50 per kWh, a Plug-in Hybrid (PHEV) may offer a lower five-year TCO. This is particularly true if the PHEV’s electric-only range covers the daily commute while avoiding the high insurance premiums and steep depreciation curves associated with large-battery BEVs. Use a five-point checklist to finalize your decision:
- Utility Mapping: Match battery range to 90% of your actual driving days, not the 10% of long-distance trips.
- Infrastructure Audit: Confirm home charging circuit capacity before purchase to avoid panel upgrade costs.
- Energy Math: Apply your local utility’s Time-of-Use (TOU) rates to the vehicle’s specific efficiency rating.
- Insurance Scrutiny: Obtain model-specific quotes to account for the 18% to 42% premium gap.
- Depreciation Hedge: Prioritize models with software-defined architectures that support long-term value through updates.
Leveraging CarQuantix Comparison Tools
Our platform acts as a filter for complex market variables. Start by selecting two 2026 models in our Car Side-by-Side Comparison tool to view the total five-year cost delta. This analysis moves beyond the MSRP by integrating real-time transaction data found in our Marketplace Listings. By reviewing our Performance Rankings, you can verify if a vehicle’s range and power justify its price point. These tools allow you to identify where a manufacturer has over-engineered a spec that does not translate into operational savings.
Conclusion: The Rational Path to EV Ownership
A data-driven approach removes the volatility from the electric vehicle cost equation. While the transition to electric power offers significant maintenance and fuel advantages, these gains are easily erased by unoptimized charging habits or high depreciation in luxury segments. The most successful buyers are those who treat their vehicle as a utility asset rather than a lifestyle purchase. Focus on the metrics, verify your regional energy rates, and select the segment that offers the highest value-per-mile. Use our Electric Vehicle Charging Cost Calculator to see your potential savings.
Execute a Data-Driven Vehicle Acquisition
Achieving financial efficiency in the 2026 automotive market requires moving beyond the sticker price to analyze the complete lifecycle of the asset. You've identified that the true electric vehicle cost is a balance of front-loaded acquisition expenses against long-term operational savings. Success depends on your ability to mitigate the 58.8% average depreciation rate through strategic model selection and maximizing home charging utility. By utilizing objective data rather than marketing narratives, you can secure a vehicle that aligns with your specific performance requirements and budget constraints.
Our platform provides the necessary tools to navigate these complex variables with precision. Access objective 0-60 and performance rankings for over 200 vehicles and apply our localized fuel versus electricity cost methodology to your specific region. Calculate your total ownership cost with CarQuantix Tools to transform uncertainty into a definitive financial strategy. You're now equipped to make a choice grounded in logic and long-term utility.
Frequently Asked Questions
Is it cheaper to charge an EV at home or buy gas in 2026?
Yes, home charging remains significantly more economical than purchasing gasoline. At the July 2026 national average gasoline price of $3.79 per gallon and residential electricity at 18.83 cents per kWh, an efficient EV costs approximately 5.4 cents per mile to operate. A comparable gasoline vehicle averaging 30 MPG costs nearly 12.6 cents per mile. This delta results in annual energy savings of over $800 for a driver traveling 12,000 miles.
How much does it cost to install a Level 2 charger at home?
Expect to spend between $1,050 and $3,200 for a complete professional installation. This total includes hardware costs of $500 to $900 and labor ranging from $400 for basic circuit additions to $2,000 for full electrical panel upgrades. Municipal permits and safety inspections typically add another $150 to $300. Since federal charger tax credits expired in June 2026, you should investigate regional utility rebates to offset these upfront expenses.
Do electric vehicles have higher insurance rates?
Yes, insuring an electric vehicle currently costs more than a gasoline equivalent. In 2026, full-coverage premiums for EVs average $3,500 to $4,000 annually, while gasoline cars average $2,700. This 42% increase is driven by higher repair complexities and the substantial expense of battery pack replacements. However, the gap is narrowing to approximately 18% for 2024 and newer model years as specialized repair networks expand and diagnostic tools become more accessible.
What is the average lifespan of an EV battery in 2026?
Most 2026 electric vehicle batteries are engineered to maintain functional capacity for 150,000 to 200,000 miles. While degradation occurs over time, thermal management advancements have extended the effective lifespan to roughly 15 to 20 years for average drivers. Manufacturers generally support this with warranties covering eight years or 100,000 miles. Battery health is now a critical metric in determining a used electric vehicle cost and its eventual resale value.
Are maintenance costs significantly lower for electric cars?
Yes, annual routine service is estimated to be $600 to $1,500 cheaper than internal combustion models. You eliminate expenses for oil changes, spark plugs, and complex transmission repairs. Regenerative braking also extends the life of pads and rotors. You must, however, account for accelerated tire wear. The high torque and curb weight of EVs increase tire replacement frequency, which is a necessary variable in any accurate electric vehicle cost calculation.
How much does an EV lose in value over the first three years?
Electric vehicles currently lose value faster than other segments, averaging a 58.8% loss over five years. This is notably higher than the 45.6% average for all vehicle types in 2026. Rapid technological shifts and concerns over battery longevity drive this steeper curve. Buyers can mitigate this by selecting models with software-defined architectures that receive regular efficiency and feature updates, which helps maintain the asset's relevance in the used market.
Can I get a tax credit for a used electric vehicle?
No, federal tax credits for used electric vehicles are no longer available. The $4,000 incentive program for used models ended for vehicles acquired after September 30, 2025. Current federal benefits are limited to a tax deduction for loan interest and regional utility rebates for charging equipment. Prospective buyers should verify state-level programs, as some localized incentives may still exist in specific regions to encourage secondary market adoption.
What happens to the cost if I only use public fast chargers?
Relying exclusively on public DC fast chargers can erase the operational cost advantage of an EV. Average fast charging rates reached $0.50 per kWh in early 2026, which is nearly triple the cost of residential electricity. At these prices, your per-mile energy cost matches or exceeds that of a gasoline vehicle. Public infrastructure should be viewed as a secondary convenience for long-distance travel rather than a primary energy source for daily commuting.