
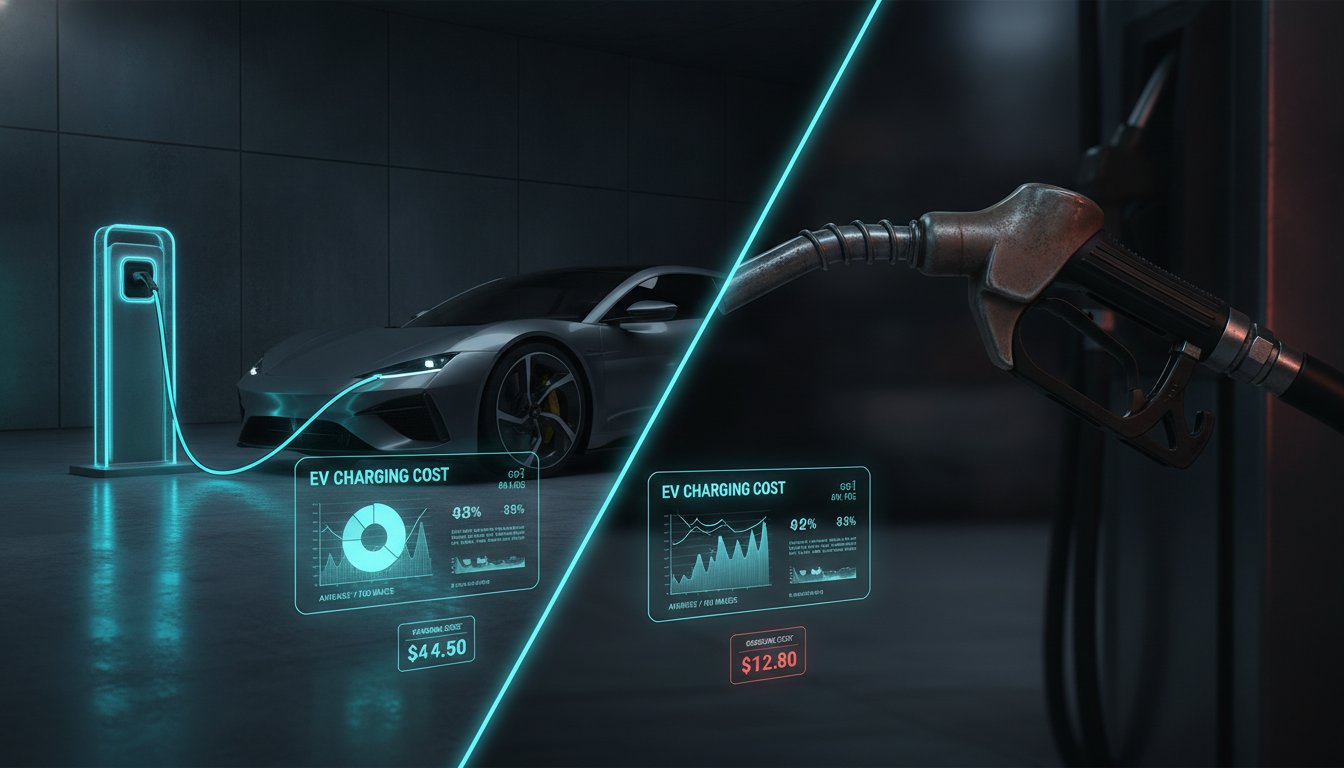
With U.S. residential electricity rates rising 7.4% year-over-year to an average of 18.83¢ per kWh, the financial advantage of electric propulsion is no longer a simple assumption. Relying on a surface-level ev charging cost vs gasoline calculator often ignores critical variables like the 2.3% annual battery degradation rate or the inherent efficiency losses found in Level 2 home charging systems. You likely recognize that gasoline prices, currently averaging $3.83 per gallon, are too volatile for reliable long-term budgeting, yet converting energy units into a functional MPG equivalent remains a frustrating barrier to financial clarity.
This analysis promises to demystify fuel parity by providing a rigorous, data-driven framework for your evaluation. You'll gain the specific insights needed to calculate a definitive break-even timeline while accounting for the 2025 expiration of federal purchase incentives and the 42-cent-per-kWh reality of public charging networks. We will examine how to construct a multi-year financial forecast that incorporates performance-adjusted energy consumption and regional regulatory shifts to ensure your next automotive decision is grounded in mathematical certainty.
Key Takeaways
- Define fuel parity as the specific equilibrium point where energy costs per mile equalize, requiring a precise ev charging cost vs gasoline calculator to navigate tiered utility rates and volatile oil markets.
- Master the conversion of MPGe to quantify the "Efficiency Gap," which explains why high-performance electric vehicles maintain lower operational costs than internal combustion equivalents.
- Integrate total ownership variables into your financial model, specifically accounting for the "Tire Wear Paradox" and the distinct maintenance intervals associated with battery-electric drivetrains.
- Identify and calculate "Charging Efficiency Loss" to account for the energy dissipated as heat during the AC-to-DC conversion process, a critical factor in determining true Level 2 charging expenses.
- Utilize CarQuantix side-by-side comparison tools to execute a multi-year financial forecast based on real-world marketplace data and performance-adjusted energy consumption.
Table of Contents
The Logic of Fuel Parity: Why a Simple Comparison Fails
Fuel parity represents the specific threshold where energy expenditures for propulsion equalize across different vehicle platforms. Achieving this parity is rarely a linear process. While gasoline markets operate under extreme price volatility, utility rates are typically more stable but often structured in tiers that punish high consumption. This discrepancy makes a standard ev charging cost vs gasoline calculator essential for any driver attempting to forecast long-term operational expenses. True parity rests on three pillars: the raw cost of the fuel, the efficiency of the drivetrain, and the capital investment in charging infrastructure.
To refine this analysis, we utilize the concept of Performance-Adjusted Cost (PAC). This metric accounts for the reality that energy consumption is not a static number. A vehicle's PAC fluctuates based on environmental conditions and driver behavior, creating a more accurate picture of fiscal reality than a manufacturer's sticker price. Without adjusting for performance, you're merely guessing at your future liabilities.
The Problem with Basic Cost-per-Mile Estimates
Using a single national average for gasoline prices to build a five-year budget is a flawed methodology. Between July 2026 and the end of a typical ownership cycle, fuel prices can swing by 40% or more, whereas electricity rates, which averaged 18.83¢ per kWh in early 2026, tend to follow more predictable regulatory cycles. Electric vehicles introduce their own variables through regenerative braking. In urban environments, EVs often outperform their EPA estimates by capturing kinetic energy. Conversely, highway cruising at high speeds can significantly degrade efficiency. This contrast is more pronounced than in internal combustion engine (ICE) vehicles, where high-performance driving increases consumption but doesn't necessarily trigger the same thermal management energy draws found in battery systems.
Defining the EV Charging vs. Gasoline Calculator Framework
A functional ev charging cost vs gasoline calculator must move beyond simple multiplication. It requires granular inputs such as specific annual mileage, local utility rate structures, and the fuel octane requirements of the compared ICE vehicle. High-performance engines often require 91 or 93 octane, which carries a significant price premium over the $3.83 national average for regular unleaded.
The output of this framework provides a comprehensive view of the Total cost of ownership for EVs. Specifically, users must analyze metrics like the cost per 100 miles and a definitive break-even timeline. For a deeper dive into the mechanics of these variables, review our guide on Electric Vehicle Cost: A Data-Driven Analysis of Total Ownership (2026). This systematic approach ensures that your multi-year financial forecast is built on evidence rather than optimistic projections.
Quantifying the Variables: kWh vs. Gallons
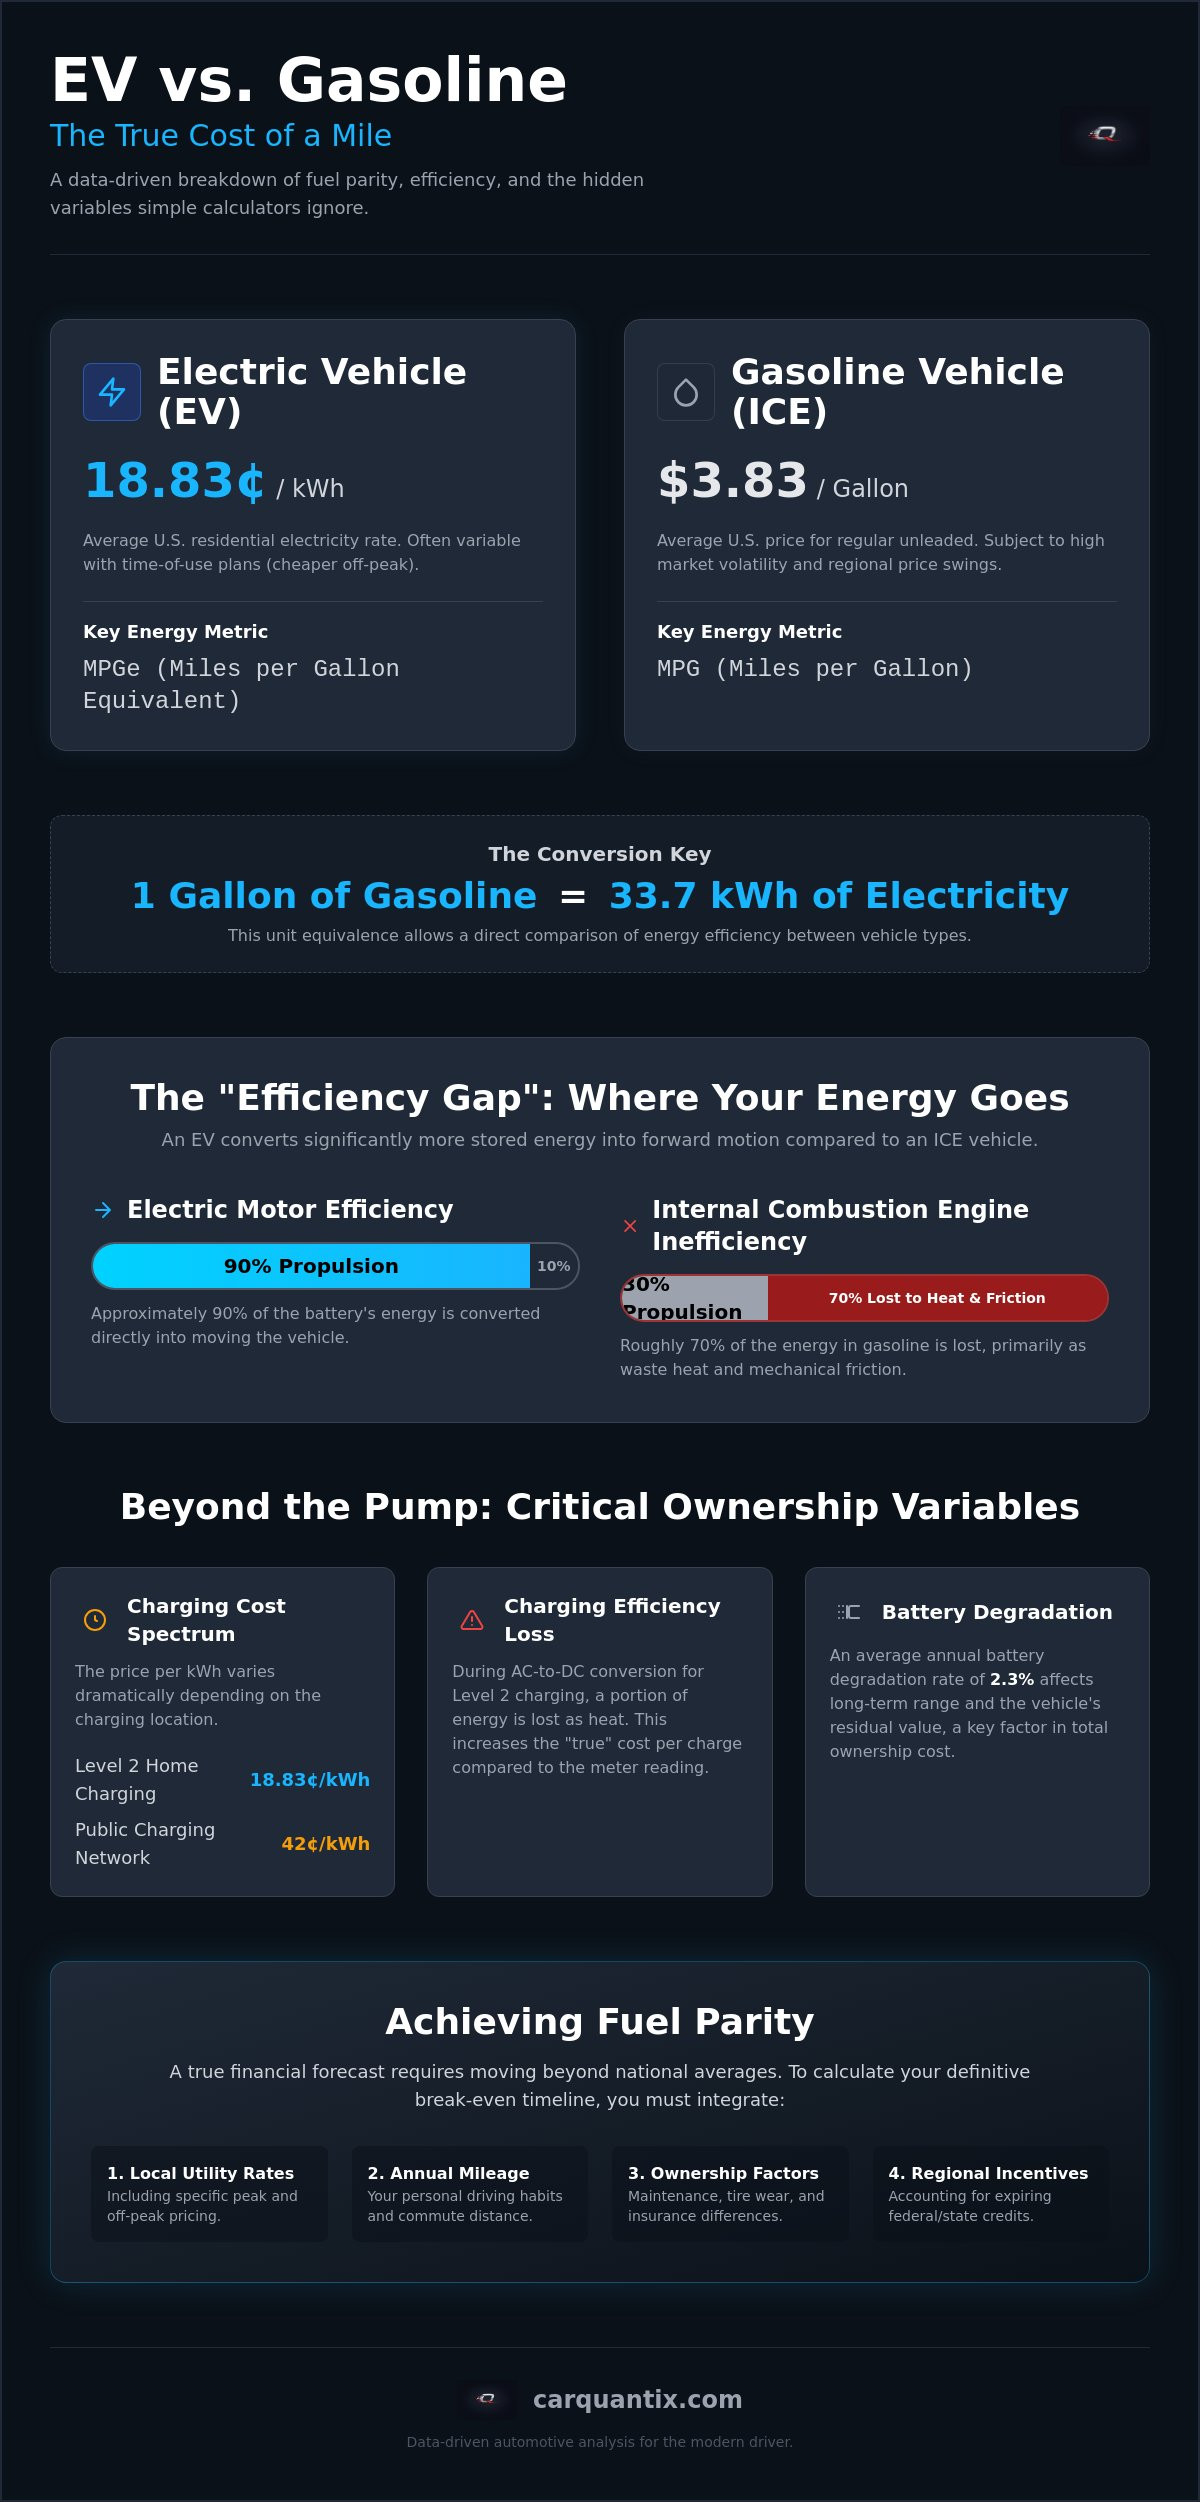
To compare disparate energy sources, you must first normalize the units of measurement. The primary metric for this comparison is Miles per Gallon Equivalent (MPGe). MPGe is the distance a vehicle can travel on 33.7 kWh of electricity. This figure represents the precise energy content of one gallon of gasoline, allowing for a direct thermal efficiency comparison between platforms. When you utilize an ev charging cost vs gasoline calculator, this conversion factor serves as the mathematical foundation for every subsequent calculation.
The "Efficiency Gap" between internal combustion engines (ICE) and electric motors is significant. A 300hp EV operates with approximately 90% efficiency, converting nearly all stored battery energy into forward motion. In contrast, a 300hp ICE vehicle loses roughly 70% of its fuel energy to heat and mechanical friction. This gap is further widened by "Idle Waste." Gasoline engines continue to consume fuel during stationary periods, whereas an EV consumes negligible power to maintain cabin electronics. These technical deltas ensure that even if electricity and gasoline reached price parity per unit of energy, the EV would remain cheaper to operate due to superior energy conversion.
Electricity Rate Structures: Peak vs. Off-Peak
Utility companies often utilize Time-of-Use (TOU) billing, which drastically alters the ROI of an electric vehicle. Standard calculators frequently rely on flat-rate assumptions, leading to errors of 20-30% in projected savings. To achieve maximum accuracy, you must input "Super Off-Peak" rates, which occur when demand is lowest. According to a University of Michigan TCO analysis, charging patterns are a dominant variable in long-term affordability. If your local rate is 18.83¢ per kWh but drops to 8¢ at night, your fuel costs effectively decrease by more than half compared to peak charging or public DC fast charging, which currently averages 42¢ per kWh.
Gasoline Octane Requirements and Performance Metrics
Performance-oriented ICE vehicles typically require 91 or 93 octane fuel to prevent engine knock and maintain rated horsepower. This requirement adds a consistent price premium over the $3.83 national average for regular unleaded. Electric vehicles do not face this performance-cost penalty; the same electricity that powers a commuter car powers a high-performance variant. You can access CarQuantix performance rankings to identify which high-horsepower EVs maintain the best efficiency-to-weight ratios. While vehicle weight increases energy consumption in both segments, the regenerative braking systems in EVs mitigate the cost of moving additional mass in stop-and-go traffic, a benefit unavailable to heavy ICE counterparts.
Total Ownership Analysis: Beyond the Fuel Pump
Evaluating the financial viability of an electric vehicle requires a perspective that extends beyond the immediate energy cost. While an ev charging cost vs gasoline calculator provides the baseline for energy parity, it doesn't account for the secondary operational variables that define the total cost of ownership. To build a robust financial forecast, you must integrate maintenance schedules, component wear rates, and the shifting landscape of federal and local incentives.
One critical variable often omitted from basic models is the "Tire Wear Paradox." Electric vehicles typically consume tires 20% faster than their internal combustion engine (ICE) counterparts. This accelerated wear results from the combination of high instantaneous torque and the increased curb weight of battery packs. When you calculate your long-term liabilities, failing to account for more frequent tire rotations and replacements will skew your break-even analysis by several hundred dollars per year. Use this data to adjust your expectations for the first 50,000 miles of ownership.
The "Tax and Rebate" factor has also shifted significantly as of 2026. Federal purchase credits for new and used clean vehicles expired on September 30, 2025. Consequently, your financial model should now focus on infrastructure incentives. The Federal Alternative Fuel Vehicle Refueling Property Credit remains available through June 30, 2026, offering a 30% tax credit (up to $1,000) for home charger installations. Integrating these specific dates into your forecast prevents the use of outdated subsidy data that no longer applies to current acquisitions.
Maintenance Cost Delta: ICE vs. EV
The mechanical simplicity of an EV drivetrain creates a substantial maintenance advantage over a 100,000-mile lifecycle. ICE vehicles require consistent expenditures for oil changes, spark plug replacements, and timing belt services. Conversely, EV maintenance focuses on cabin air filters and battery coolant flushes. Regenerative braking also extends the life of friction brake pads, often doubling their service interval compared to traditional systems. Average maintenance savings for a mid-size EV in 2026 typically range between 30% and 50% compared to equivalent ICE models, providing a predictable buffer against rising electricity rates.
Depreciation and Marketplace Metrics
Resale value is increasingly dictated by battery health rather than just odometer readings. Current data shows that EV batteries degrade at an average rate of 2.3% per year, meaning a 2026 model should retain approximately 81.6% of its capacity after eight years. This predictability allows for more accurate depreciation modeling. You can utilize the CarQuantix marketplace to track real-world price retention across different regions. While high-mileage ICE engines face steep valuation drops due to potential mechanical failure, EV batteries maintain a "Second Life" value for stationary energy storage, which stabilizes the floor of their salvage value.
The Hidden Variable: Charging Efficiency and Infrastructure
Most financial models assume a 1:1 ratio between energy purchased and energy stored. This assumption is mathematically incorrect. "Charging Efficiency Loss" represents the energy dissipated as heat during the AC-to-DC conversion process. When you use an ev charging cost vs gasoline calculator, failing to factor in this 10% to 15% overhead leads to a significant underestimation of your true operational costs. You're paying for the kilowatt-hours measured at the meter, not just the ones that reach the battery cells.
The infrastructure you choose dictates your efficiency profile. Level 1 charging, utilizing a standard 120V outlet, is the least efficient due to longer charging sessions that keep the vehicle's onboard computers and thermal management systems active for extended periods. Level 2 home charging offers a superior efficiency curve, while DC Fast Charging provides speed at the cost of a significant "Public Charging Premium." At an average of 42 cents per kWh for public stations, the cost per mile can occasionally exceed that of a gasoline vehicle averaging 30 MPG at $3.83 per gallon.
Home vs. Public Charging Financials
The financial disparity between residential and public networks is stark. U.S. residential rates averaged 18.83¢ per kWh in April 2026, while public DC fast charging networks often carry a 3x to 5x price multiplier. To maximize ROI, most owners invest in a Level 2 home station. A typical $1,000 installation, including hardware and professional labor, requires a specific break-even analysis. If you utilize the Federal Alternative Fuel Vehicle Refueling Property Credit before its June 30, 2026 expiration, you can offset 30% of this cost. Over a three-year period, the savings from avoiding public network surcharges typically amortize this initial capital expense. "Free" public charging has become a negligible variable in 2026 as municipalities and retailers transition to fee-based recovery models.
Efficiency Losses: The 15% Tax
It's common to see a utility bill reflecting 100kWh of usage while the vehicle's telemetry shows only 85kWh of gained charge. This "15% tax" is the result of resistance in the charging cables and the energy required to cool the battery during the session. Ambient temperature plays a decisive role here. In extreme heat or cold, the vehicle must divert more energy to thermal management, further degrading efficiency. You can minimize these losses by optimizing charging windows to occur during temperate overnight hours. To see how these efficiency variables impact your specific vehicle choice, access our Electric Vehicle Charging Cost Calculator for a localized data breakdown.
Executing the Calculation with CarQuantix
To finalize your financial analysis, transition from theoretical variables to empirical modeling. Integrating your specific energy consumption data into a professional ev charging cost vs gasoline calculator is the only method to achieve a precise break-even projection. The CarQuantix side-by-side comparison tool allows you to isolate variables such as charging efficiency loss and regional fuel price volatility, providing a granular view of your monthly liabilities. By inputting your actual driving habits, you move beyond national averages to a personalized fiscal roadmap.
Finding the "Sweet Spot" requires balancing performance metrics with operational efficiency. Use the CarQuantix performance rankings to identify vehicles that deliver high torque without a disproportionate increase in energy consumption. This balance is vital because, as established in previous sections, excessive torque accelerates tire wear by 20%, which can offset fuel savings if not managed correctly. Validate your assumptions by leveraging marketplace data to see how specific mileage milestones impact resale value in the 2026 market. This ensures your break-even timeline is grounded in real-world depreciation curves rather than optimistic manufacturer claims.
Follow this data-driven decision framework to determine your optimal powertrain:
- Choose EV: If your daily mileage is consistent, you have access to Level 2 home charging, and your local utility offers "Super Off-Peak" rates below 12¢ per kWh.
- Choose Hybrid: If you lack dedicated home charging infrastructure and frequently travel through regions where public DC fast charging exceeds 45¢ per kWh.
- Choose ICE: If your annual mileage is exceptionally low, making the higher upfront capital expense of an EV battery impossible to amortize within a five-year window.
Customizing Your Cost Profile
Hyper-local accuracy is achieved by uploading your specific utility bill data directly into the calculator. This accounts for tiered pricing structures that standard tools often ignore. Compare your current internal combustion vehicle against three potential EV upgrades simultaneously to see the immediate impact on your cash flow. By utilizing premium data, you can forecast 5-year ownership costs that include projected battery degradation and localized maintenance labor rates, ensuring your multi-year forecast remains resilient against energy market shifts.
Next Steps: From Data to Purchase
Once your calculation is complete, verify the availability of your selected models. You can check the CarQuantix marketplace for high-performance EV listings that match your efficiency requirements. For those requiring deeper scrutiny, consider subscribing for advanced ownership cost analysis and real-time market insights. This level of scrutiny reduces the risk of unforeseen expenses and solidifies your confidence in the transition. Access the CarQuantix EV Charging vs Gasoline Calculator today to begin your definitive financial evaluation.
Executing a Data-Driven Automotive Transition
Transitioning to electric propulsion requires a shift from anecdotal evidence to empirical modeling. You've identified that fuel parity depends on more than just the $3.83 national average for gasoline; it involves accounting for the 15% charging efficiency loss and the specific maintenance deltas of 2026 models. A robust ev charging cost vs gasoline calculator serves as the essential bridge between current utility rates and your long-term financial stability. By integrating variables like battery degradation and infrastructure CapEx, you transform a complex purchase into a predictable investment.
The path to a definitive break-even timeline is unique to your regional utility structure and driving profile. Utilize our tools to validate your assumptions with objective 5-year TCO forecasting and comprehensive performance-to-cost metrics. You can Run Your Side-by-Side Cost Analysis on CarQuantix to access real-time marketplace pricing data that reflects the current 2026 landscape. This systematic approach ensures your next vehicle acquisition is grounded in mathematical certainty. Explore the data today to finalize your strategy with confidence.
Frequently Asked Questions
Is it actually cheaper to charge an EV than to buy gas in 2026?
Yes, charging remains cheaper when utilizing residential rates. At the July 2026 average of 18.83¢ per kWh, a typical EV costs approximately 6 cents per mile. In contrast, a gasoline vehicle averaging 30 MPG at $3.83 per gallon costs nearly 13 cents per mile. This 50% reduction in fuel expenditure is the primary driver of EV adoption, though public charging rates of 42¢ per kWh can equalize these costs.
How much does charging efficiency loss affect my total cost?
Efficiency loss typically adds 10% to 15% to your total energy bill. This discrepancy occurs because your utility meter records the energy pulled from the grid, while your vehicle telemetry only shows the energy stored in the battery. Heat generated during the AC-to-DC conversion process accounts for most of this loss. Factor this efficiency tax into any ev charging cost vs gasoline calculator to ensure your budget remains accurate.
What is the break-even point for an electric vehicle vs a gasoline car?
The break-even point generally occurs between three and seven years of ownership. This timeline is dictated by the initial purchase price delta and your annual mileage. Since federal purchase tax credits expired in late 2025, the ROI depends entirely on operational savings. High-mileage drivers who charge at residential rates achieve parity faster than low-mileage drivers who rely on expensive public infrastructure.
Does fast charging cost more than home charging?
Fast charging is substantially more expensive, often carrying a 220% price premium over home charging. While residential electricity averages 18.83¢ per kWh, public DC fast charging averages 42¢ per kWh as of July 2026. This price spike is necessary to cover the capital expense of high-output hardware. Relying exclusively on public networks can result in per-mile costs that mirror those of a high-efficiency gasoline vehicle.
How do I calculate the cost per mile for an electric car?
Calculate cost per mile by dividing your local electricity rate by your vehicle’s efficiency in miles per kilowatt-hour. If your rate is 18.83¢ and your car achieves 3.5 miles/kWh, your cost is 5.38¢ per mile. Always use the rate from your specific utility bill rather than national averages to account for regional variances and tiered pricing structures that punish high consumption during peak hours.
Are maintenance savings significant enough to offset a higher EV price?
Maintenance savings are significant but should be viewed as a secondary factor in the total cost of ownership equation. EV owners typically save 30% to 50% on scheduled service over a 100,000-mile lifecycle due to fewer moving parts. While these savings help amortize the higher upfront cost, they must be combined with fuel savings and infrastructure tax credits to achieve a complete financial advantage over gasoline alternatives.
How does cold weather impact the cost of charging an EV?
Cold weather degrades charging efficiency and increases the cost per mile by 20% to 30%. Low temperatures require the vehicle to divert energy to battery heaters and cabin climate control. Furthermore, charging a cold battery is less efficient, as more energy is lost to thermal management. These seasonal fluctuations must be averaged across your annual forecast to maintain a realistic view of your total liabilities.
Can I use a standard outlet to charge, and is it cost-effective?
Standard 120V outlets are functional for emergency use but are the least cost-effective charging method. Level 1 charging is approximately 15% to 20% less efficient than Level 2 because the vehicle's onboard computers must remain active for up to 50 hours to reach a full charge. This constant energy draw for electronics increases the total kilowatt-hours required to replenish the battery, effectively raising your true cost per mile.