

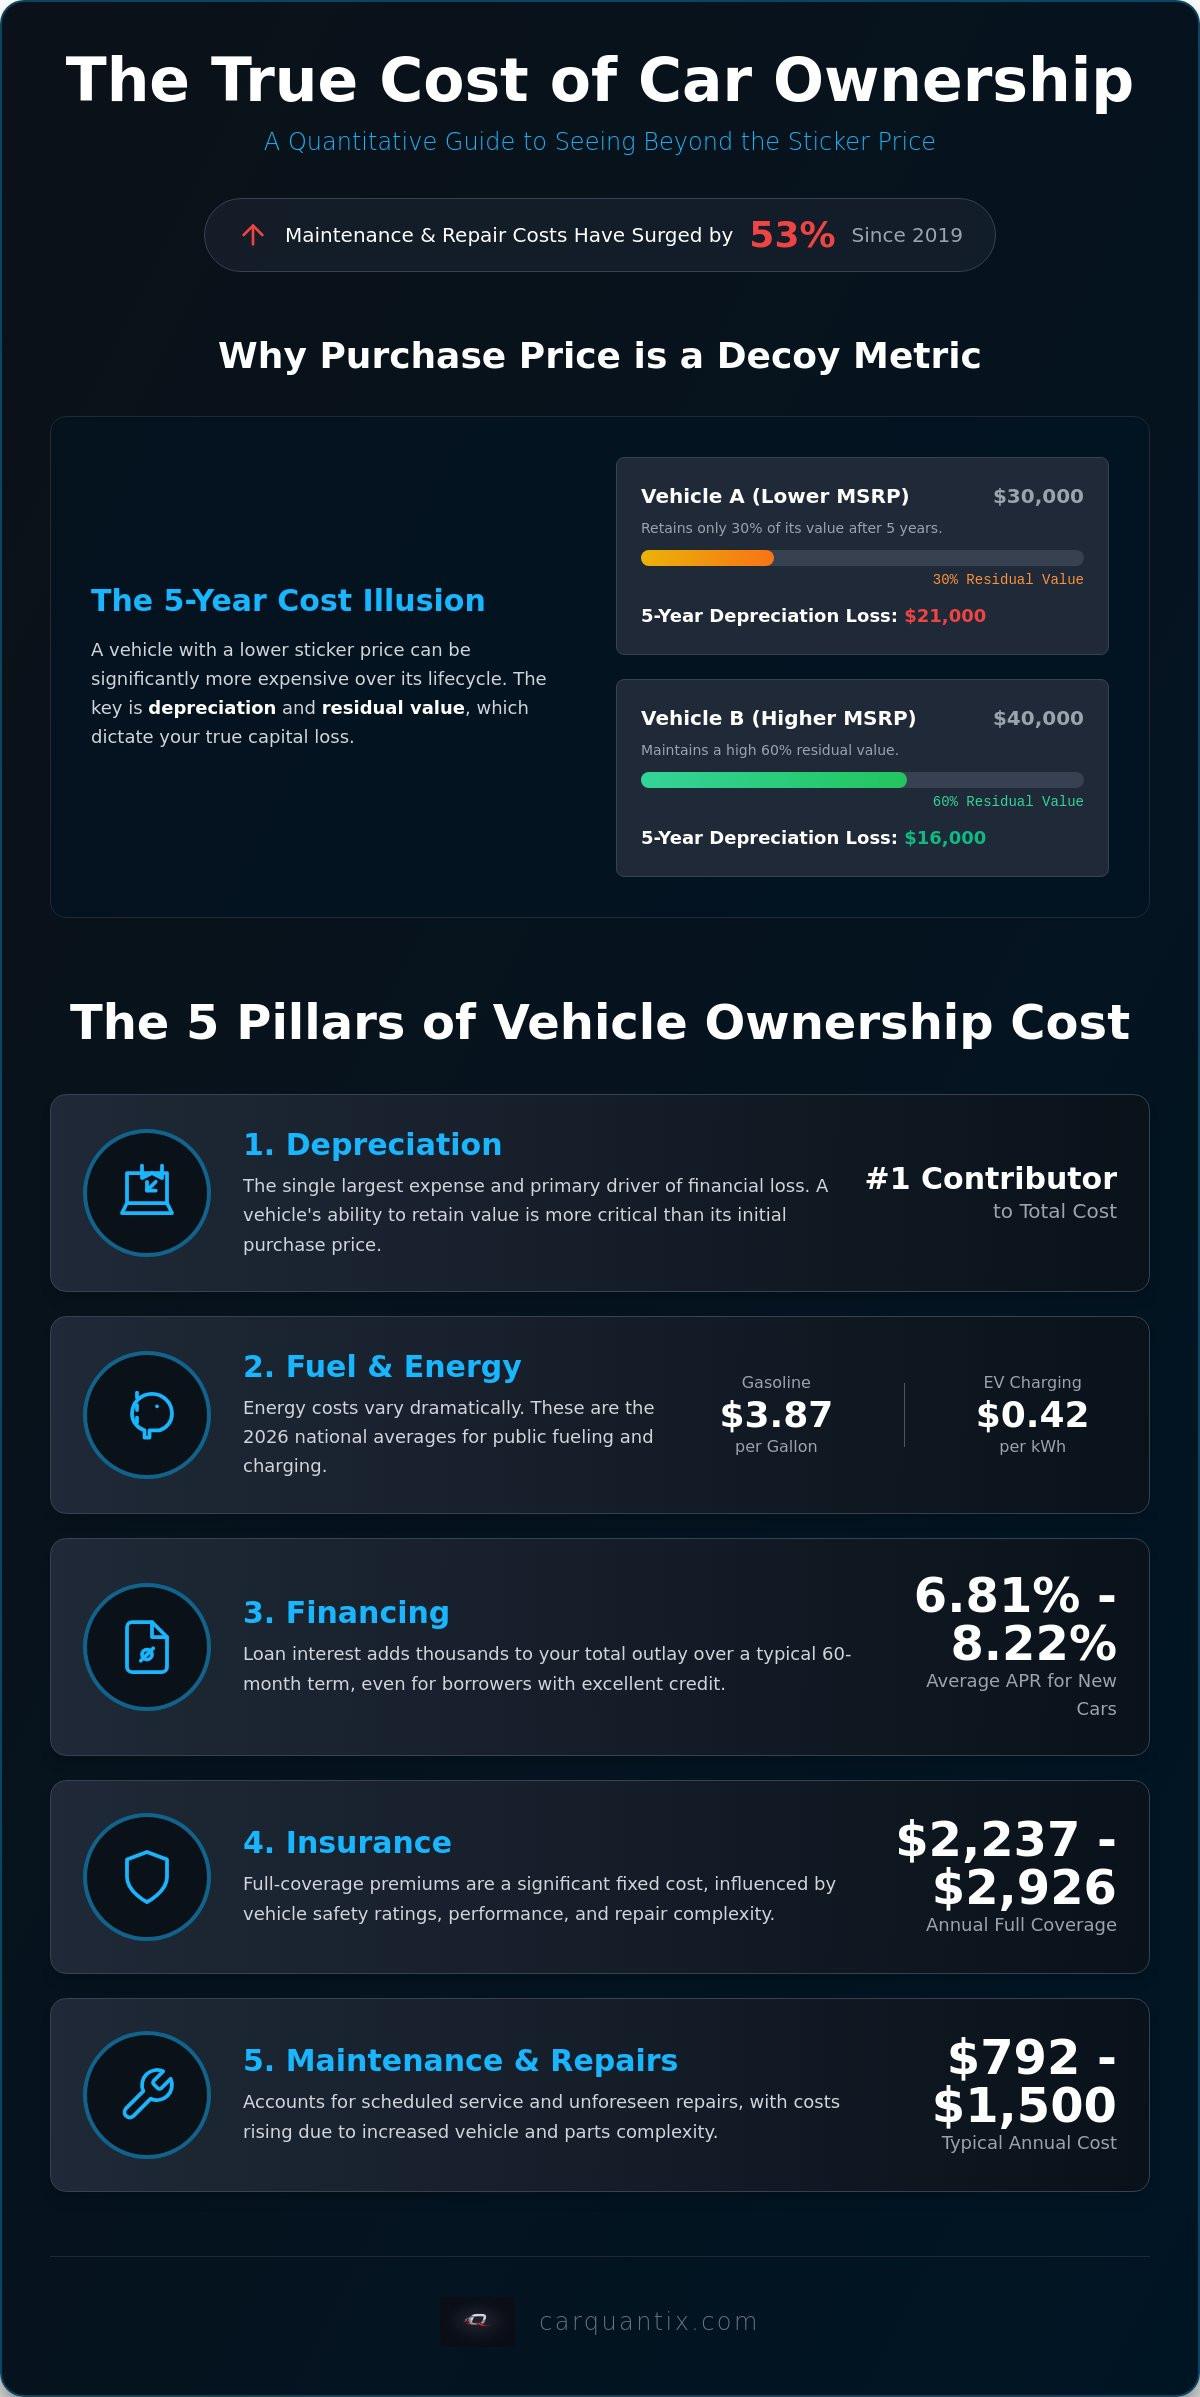
The cost of vehicle maintenance and repairs has surged by approximately 53% since early 2019, rendering the initial sticker price a poor indicator of long-term financial health. You likely recognize that a car's value involves more than just a monthly payment, yet opaque service schedules and unpredictable depreciation rates make it difficult to calculate the true impact on your capital. With the national average for full-coverage insurance now reaching up to $2,926 annually, the margin for error in your budget has narrowed significantly. This guide provides a rigorous total cost of ownership car comparison framework to help you move beyond surface-level pricing and identify the hidden variables of your next purchase.
We'll analyze the mechanics of depreciation and compare 2026 energy costs, such as the $3.87 national gas average versus the $0.42 per kilowatt-hour public charging rate. Our objective is to provide the data required to justify a high-performance or electric vehicle purchase while eliminating financial surprises over the ownership lifecycle. This systematic review transitions your decision-making process from speculative estimation to quantitative certainty by focusing on the underlying mechanics of vehicle expense.
Key Takeaways
- Differentiate between immediate out-of-pocket expenses and non-cash variables like depreciation to identify the primary drivers of capital loss.
- Implement a rigorous total cost of ownership car comparison by standardizing ownership duration and aggregating granular energy consumption data.
- Calculate the "Efficiency Ratio" to objectively measure performance output relative to the total financial investment required over the vehicle's lifecycle.
- Leverage integrated calculators and marketplace metrics to eliminate the ambiguity associated with fluctuating fuel prices and public charging rates.
- Apply a systematic framework to move beyond marketing hyperbole and justify high-performance or electric vehicle acquisitions through verifiable data.
Table of Contents
Defining Total Cost of Ownership in a Modern Car Comparison
A comprehensive Total Cost of Ownership (TCO) represents the aggregate of every dollar spent on a vehicle from the moment of acquisition to the final act of disposal. Most consumers mistake the Manufacturer's Suggested Retail Price (MSRP) for the true cost, yet this sticker price is a statistically flawed baseline. It ignores the 53% increase in maintenance and repair costs recorded between 2019 and 2026. A rigorous total cost of ownership car comparison must distinguish between immediate out-of-pocket expenses, such as fuel and insurance, and non-cash expenses like depreciation. Without this distinction, your financial projections will fail to reflect the actual drain on your capital over time.
Establishing a 2026 baseline requires accounting for a volatile energy market and the expiration of federal purchase incentives. With national gasoline averages at $3.87 per gallon and public EV charging reaching $0.42 per kilowatt-hour, the delta between powertrain types is no longer static. You can't rely on outdated estimates when annual insurance premiums for full coverage now reach as high as $2,926. This environment demands a data-driven approach that treats every vehicle as a long-term financial commitment rather than a one-time purchase.
The Mathematical Components of TCO
Ownership costs fall into two primary categories: fixed and variable. Fixed costs include insurance, taxes, and financing interest, which currently averages between 6.81% and 8.22% for new vehicle loans. Variable costs fluctuate based on your mileage, encompassing energy and routine maintenance. CarQuantix methodology standardizes these variables by applying real-world consumption data to fixed intervals, ensuring an objective review. This process also accounts for opportunity cost. This metric measures the potential return on capital if your money were invested in a high-yield account rather than being locked into a depreciating asset.
Why Purchase Price is a Decoy Metric
The purchase price often functions as a decoy that obscures long-term value. Analysis frequently reveals cases where a $40,000 vehicle is significantly cheaper over five years than a $30,000 alternative. This occurs when the more expensive car maintains a 60% residual value while the cheaper model retains only 30%. High residual values directly mitigate the impact of depreciation, which remains the primary driver of financial loss in new vehicle acquisitions. Total Cost of Ownership is the only metric that accounts for the full economic reality of vehicle use. By focusing on the net cost after 60 months of operation, you gain a transparent view of your capital's efficiency.
The Five Pillars of Vehicle Ownership Scrutiny
Executing a precise total cost of ownership car comparison requires a granular analysis of five distinct financial pillars. These variables dictate the long-term viability of your investment. According to data regarding the Average Cost of Owning and Operating an Automobile, these expenses extend far beyond the showroom floor. You must evaluate each pillar independently to understand how they interact with your specific driving profile and regional economic conditions.
- Depreciation: This remains the primary driver of financial loss. New vehicles often lose a significant portion of their value within the first 36 months.
- Fuel and Energy: In July 2026, the national average for gasoline is $3.87 per gallon. Compare this to the $0.42 per kilowatt-hour average for public Level 2 EV charging to determine your energy delta.
- Financing: Interest rates for new car loans currently range from 6.81% to 8.22% for borrowers with excellent credit. These rates can add thousands to your total capital outlay over a standard 60-month term.
- Insurance: Annual full-coverage premiums now average between $2,237 and $2,926. High-performance specifications or poor safety ratings can push these figures even higher.
- Maintenance and Repairs: Annual maintenance costs typically fall between $792 and $1,500. This pillar accounts for both scheduled service and unscheduled repairs, which have become more expensive due to parts complexity.
Analyze these figures before committing to a purchase. You can use our Car Side-by-Side Comparison tool to see how these pillars fluctuate between different models.
Depreciation and Residual Value Mechanics
Depreciation curves vary wildly by vehicle segment. Luxury sedans often experience steeper initial drops compared to mid-sized SUVs, which benefit from higher market demand. Brand-specific trends also play a critical role; some manufacturers maintain high residual values through disciplined production, while others erode owner equity with heavy fleet sales. For those considering a transition to battery power, review our electric vehicle cost analysis to understand how EV-specific depreciation differs from internal combustion standards.
Maintenance Projections and Reliability Data
Distinguish between preventative maintenance and corrective repairs. Preventative costs are predictable, following manufacturer-mandated schedules for fluids and filters. Corrective repairs are volatile and often correlate with a vehicle's technical complexity. High-performance components like carbon-ceramic brakes or specialized tires significantly inflate your TCO. We utilize real-world data from marketplace listings to identify mileage milestones where wear-and-tear expenses typically spike. This methodology allows you to project costs with a level of accuracy that generic estimates cannot provide.
Performance Metrics vs. Economic Efficiency
High-performance vehicles are often excluded from standard economic discussions, yet they represent a significant data set in any total cost of ownership car comparison. Performance is essentially an efficiency trade-off where horsepower correlates directly with increased fuel consumption and insurance premiums. Recent data on the total cost of ownership for popular vehicles indicates that performance-oriented trims can carry a TCO premium of 15% to 30% over their base-model counterparts. This "Efficiency Ratio" measures performance output, such as horsepower or torque, per dollar of total ownership cost. It allows you to quantify the exact price of speed rather than relying on subjective "feel."
Physical variables like vehicle weight and tire width also dictate variable maintenance expenses. A performance EV, while energy-efficient, often weighs 20% more than a comparable ICE vehicle due to battery density. This mass, combined with immediate torque delivery, accelerates tire tread wear and stresses suspension components. High-performance ICE vehicles face similar challenges. Wider, staggered tire setups prevent standard rotation and increase replacement frequency. You must calculate these maintenance deltas to understand the true financial logic of a performance purchase. Performance is never free; it's simply a matter of where the costs manifest in the ledger.
The Cost of Acceleration and Top Speed
0-60 mph metrics serve as a proxy for specialized component wear. Sub-4-second acceleration requires high-friction braking systems and soft-compound tires that may require replacement every 15,000 miles. Insurance carriers also apply a performance ranking penalty. This surcharge reflects the higher statistical probability of high-speed incidents and the increased cost of repairing carbon fiber or lightweight alloy body panels. For a broader perspective on how performance scales across different vehicle types, review our car vs motorcycle performance comparison.
Engineering for Longevity: Build Quality as a Cost Saver
Drivetrain complexity remains a critical factor in long-term repair frequency. A high-performance ICE engine with multiple turbochargers and complex cooling systems presents more failure points than a dual-motor EV drivetrain. However, the trade-off involves sophisticated technology like Advanced Driver Assistance Systems (ADAS). These sensors are often located in vulnerable areas like bumpers and windshields. This makes minor repairs significantly more expensive. Objective review suggests that over-engineered vehicles with simplified mechanical layouts often provide superior TCO advantages. They trade mechanical complexity for electronic reliability, which often results in fewer unscheduled service visits over a 60-month ownership period.
Methodology for a Systematic Car Comparison
Executing a rigorous total cost of ownership car comparison requires a standardized sequence of evaluation to eliminate the bias inherent in anecdotal reviews. You must treat the vehicle as a depreciating asset with specific operational overhead. This process transitions your decision from an emotional preference to a calculated financial strategy. Follow these five steps to isolate the true economic impact of your next vehicle purchase.
- Step 1: Standardize the ownership duration. Use a fixed interval of 36, 60, or 84 months. A 60-month period is the industry standard for capturing the intersection of depreciation and rising maintenance costs.
- Step 2: Aggregate real-world energy consumption. Utilize our car fuel cost calculator to compare the $3.87 national gasoline average against the $0.42 per kilowatt-hour public charging rate. This delta often dictates the entire TCO advantage of one powertrain over another.
- Step 3: Obtain localized insurance quotes. Request specific figures based on vehicle VINs rather than generic model averages. National full-coverage rates vary between $2,237 and $2,926, making localized data essential for accuracy.
- Step 4: Factor in regional tax incentives and fees. Account for the expiration of federal EV purchase credits on September 30, 2025. However, include the 30% federal tax credit for home charging infrastructure available until June 30, 2026.
- Step 5: Apply the depreciation discount. Subtract the projected residual value from the initial purchase price to determine the net capital loss over your defined ownership term.
To begin your evaluation with verified data, use our Car Side-by-Side Comparison tool to isolate these cost-heavy variables.
Utilizing Digital Tools for Data Accuracy
Side-by-side comparison tools allow you to isolate specific variables like fuel economy or insurance groupings without the distraction of marketing hyperbole. You must use current marketplace data for used car pricing to ensure your depreciation estimates reflect real-world demand. Verify manufacturer maintenance intervals against independent reliability data to identify potential discrepancies in long-term service requirements. This scrutiny prevents you from relying on "best-case scenario" schedules that rarely materialize in actual use.
Adjusting for Regional and Environmental Variables
Environmental factors significantly impact TCO through energy efficiency and component longevity. Extreme climates can reduce EV battery range and long-term health, while high-heat environments accelerate the degradation of rubber seals and cooling systems in ICE vehicles. Calculate the role of local fuel prices, as state-level gas prices currently range from $3.06 to $5.46 per gallon. Finally, factor in urban congestion. Frequent stop-and-go driving increases the wear rate on brake systems and transmissions, necessitating more frequent corrective repairs than highway-centric driving profiles.
The CarQuantix Approach: Logic Over Hyperbole
Traditional automotive journalism often prioritizes subjective comfort ratings and aesthetic appeal. This approach fails to provide a viable financial roadmap. CarQuantix functions as an impartial filter between you and complex automotive data. We replace vague star ratings with quantitative metrics that actually impact your ledger. By utilizing a structured total cost of ownership car comparison, we provide the mechanics for a disciplined decision-making process. Our platform relies on SaaS-level data to analyze variables like the 53% increase in repair costs documented through early 2026. This ensures your financial model reflects current market realities rather than historical averages.
Structured vehicle listings within our marketplace offer more than just availability. They provide real-world mileage and pricing benchmarks essential for accurate depreciation modeling. You don't have to guess the residual value of a high-performance EV or a heavy-duty SUV. Instead, you can observe how market demand influences the net cost of ownership over a 60-month term. This methodology ensures that every comparison is grounded in utility and logic rather than the emotional hyperbole found in lifestyle marketing.
Empowering the Rational Buyer
Data-driven Performance Rankings allow you to identify the "sweet spot" where performance output meets economic efficiency. For commercial fleet managers, this systematic review is vital for maintaining operational margins. For private buyers, it reduces the emotional bias that often leads to over-extending capital on high-depreciation assets. By evaluating a vehicle's Efficiency Ratio, you can justify a higher initial investment if the long-term TCO data supports the expenditure. This approach empowers you to make a choice based on clarity and evidence rather than excitement.
Conclusion and Strategic Next Steps
A rigorous total cost of ownership car comparison is no longer optional in a market defined by fluctuating energy prices and high interest rates. You must account for the $2,926 annual insurance ceiling and the $3.87 national gas average to protect your long-term financial health. The expiration of federal EV purchase credits on September 30, 2025, further underscores the need for current, localized data. Use the CarQuantix toolset to validate your next automotive investment through objective scrutiny rather than speculation. Execute your side-by-side car comparison on CarQuantix today.
Finalizing Your Automotive Financial Strategy
Transitioning from speculative estimation to quantitative certainty requires a commitment to data integrity. You now recognize that depreciation and variable energy costs dictate the long-term viability of your capital more than the initial MSRP. By applying the "Efficiency Ratio" and standardizing your ownership duration, you eliminate the emotional bias that often leads to sub-optimal acquisitions. A rigorous total cost of ownership car comparison acts as your primary defense against unpredictable maintenance schedules and fluctuating residual values in a volatile market. It's the difference between a lifestyle purchase and a strategic investment.
Access premium automotive data and performance rankings to validate your next major decision. Calculate energy costs with precision using our integrated calculators to ensure your budget remains resilient against shifting utility rates and fuel prices. Discipline during the research phase prevents financial surprise throughout the ownership lifecycle. We provide the tools to filter through the noise of traditional marketing and focus on the mechanics of value. Analyze your next vehicle with CarQuantix comparison tools to secure a transparent view of your automotive future. Your next car should be a calculated asset, not a financial mystery.
Frequently Asked Questions
What is the single most significant factor in total cost of ownership?
Depreciation is the single most significant factor in vehicle ownership. It represents the loss in market value between the time you acquire the asset and the time you sell it. For most new vehicles, this non-cash expense exceeds the combined costs of fuel, insurance, and maintenance. Calculating this variable accurately requires analyzing historical resale data and current market demand for specific segments and brands.
Does an electric car always have a lower TCO than a gasoline car?
An electric car does not always have a lower TCO. While electricity is generally cheaper per mile than gasoline, the initial purchase premium and potential for faster depreciation can negate these savings. If you drive low annual miles or live in a region with high utility rates, the energy savings may never recover the upfront investment. A thorough total cost of ownership car comparison is required to find the break-even point.
How does vehicle depreciation differ between luxury and economy brands?
Luxury brands typically lose value at a faster rate than economy brands. This steeper curve is driven by the rapid obsolescence of high-end technology and the high cost of out-of-warranty repairs, which discourages secondary market buyers. Economy brands benefit from a larger pool of used-car shoppers who prioritize reliability and lower operational costs. This sustained demand helps stabilize the residual value of budget-oriented vehicles over time.
Can a high-performance car ever be a rational financial choice?
A high-performance car can be a rational choice if it demonstrates exceptional asset retention. Certain limited-production models or those with high collector demand experience much slower depreciation than standard consumer vehicles. When the loss of equity is minimal, the ownership cost may actually be lower than that of a rapidly depreciating mid-range sedan. Rationality in this context is defined by net capital loss rather than fuel efficiency.
How many years of ownership should I use for a TCO comparison?
You should use a 60-month ownership period for a standard comparison. This five-year window is the most effective interval for capturing the intersection of the initial depreciation drop and the onset of major maintenance milestones. It also accounts for the expiration of most manufacturer warranties, providing a transparent view of the potential repair liabilities that occur as a vehicle ages beyond its first three years of service.
What maintenance costs are most commonly overlooked in a car comparison?
Specialized consumables like high-diameter tires and performance-grade brake components are the most commonly overlooked expenses. Many buyers focus on routine oil changes but fail to account for the specialized labor and parts required for modern Advanced Driver Assistance Systems (ADAS). These sensors often require expensive recalibration after minor repairs or windshield replacements. These technical requirements can significantly inflate the total operational budget over several years.
How do interest rates impact the total cost of ownership over five years?
Interest rates act as a compounding fixed cost that increases the total capital outlay. High rates for auto loans directly inflate the monthly obligation and the total amount paid over the life of the loan. This expense is independent of how much you drive, making it a critical variable for those financing a significant portion of the purchase price. Every percentage point increase in APR adds hundreds to the final ownership cost.
Is it better to buy a car with a lower purchase price or a higher residual value?
It is generally better to prioritize a higher residual value over a lower purchase price. A vehicle with a higher upfront cost that retains 60% of its value will often result in a smaller net loss than a cheaper car that retains only 35%. The goal of a total cost of ownership car comparison is to minimize the cost to use the asset. Efficiency is found in the net position after disposal.